Product Update: Enhanced Review Analytics Dashboard
Introducing our new Review Analytics dashboard for deeper customer feedback insights.
Posted by
Related reading
Import Reviews from Anywhere: Google, LinkedIn, and Beyond
Manually add individual reviews or bulk import via CSV — bring your best testimonials from any platform into SnapSentiment and display them alongside your verified Stripe reviews.
Introducing Verified Stripe Review Badges
Every review collected through SnapSentiment now displays a blue verified badge — proving the reviewer is a real Stripe customer. More trust, more conversions.
Sign Up and Start Collecting Reviews for Free
Every new SnapSentiment account comes with free credits so you can run a real review collection campaign — no credit card required. Here's how to make the most of them.
What's New
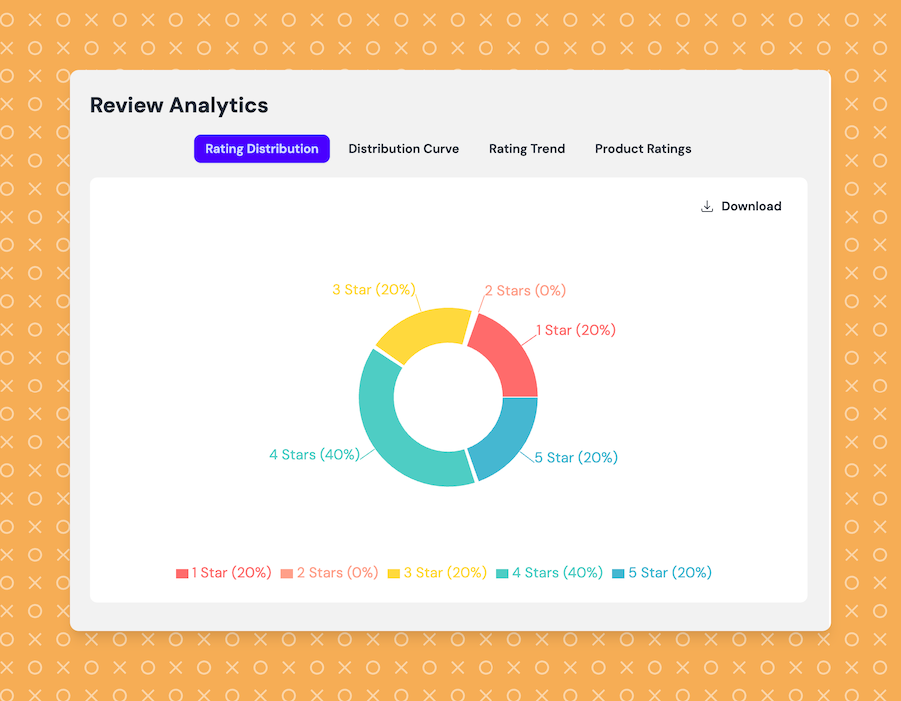
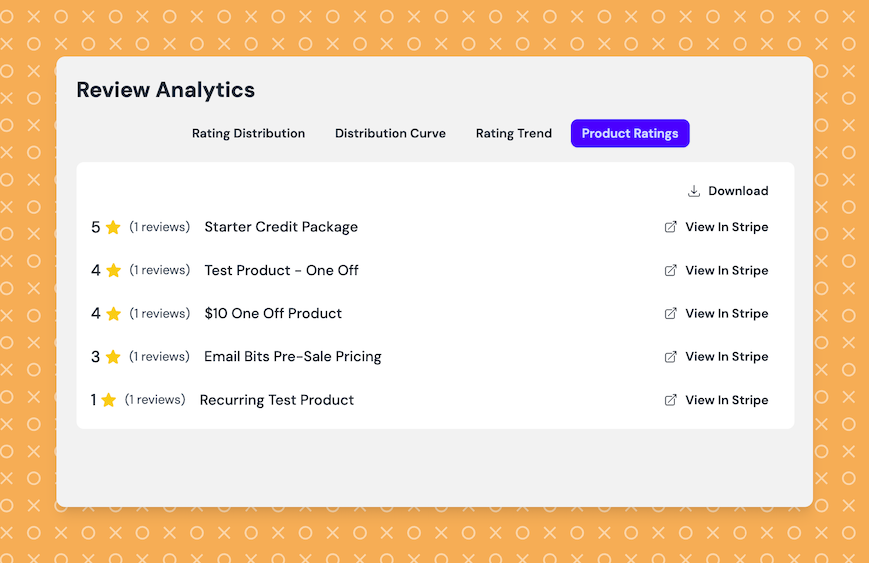
The Review Analytics dashboard now features four powerful visualization tools:
- Rating Distribution - See your review breakdown across star ratings at a glance with our intuitive pie chart
- Distribution Curve - Analyze rating patterns to identify polarization or consistency in customer sentiment
- Rating Trend - Track review performance over time to measure the impact of product improvements
- Product Ratings - Compare performance across your entire product catalog with consolidated metrics
Why It Matters
These visual analytics tools help you:
- Identify products that need attention (those with 1-2 star ratings)
- Discover your top performers to understand what's working
- Track sentiment trends to measure the impact of product improvements
- Generate exportable reports for team meetings and business reviews
Ready to dive into your review analytics? Log in to your dashboard to explore these new features and turn customer feedback into actionable business intelligence.