The SnapSentiment Analytics Dashboard provides powerful visualization tools to help you understand customer sentiment and track review performance across your product catalog. This documentation covers each visualization component and how to leverage them for actionable insights.
The analytics dashboard updates every 15 minutes. For real-time data, use the "Refresh" button in the dashboard header.
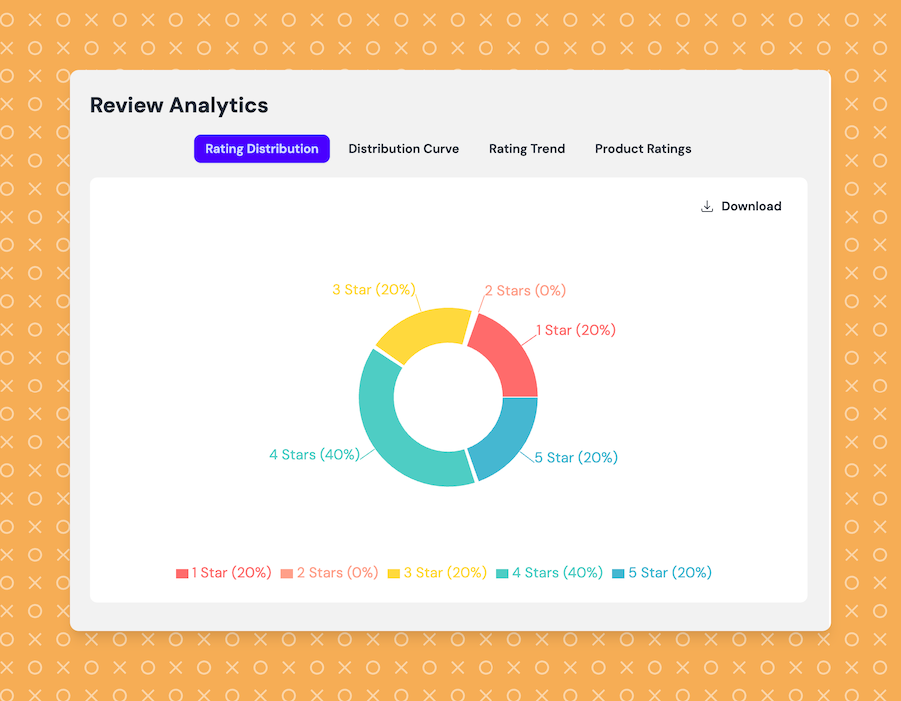
Access analytics data programmatically through our REST API:
// Example API request for rating distribution
GET /api/analytics/distribution
{
  "timeRange": "30D",
  "productId": "optional-product-id"
}

// Response
{
  "distribution": {
    "1": 45,
    "2": 78,
    "3": 156,
    "4": 423,
    "5": 892
  },
  "total": 1594,
  "average": 4.28
}
Export analytics data in multiple formats:
Analytics data is retained for 24 months. Export historical data before it expires if needed for long-term analysis.